# Title: R Margins, single figure example
# Date: 2008-02-04
# Project: CFL R graphics

rm(list = ls())		# clear objects
graphics.off() 		# close graphics windows

# Generate data
x = 0:10;
y = 0:10;

# Plot the data

# - Specify the layout parameters before any plotting
#   If you don't specify them before any plotting, the
#   results will be inconsistent and misaligned.
#
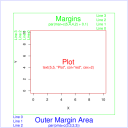
# - oma stands for 'Outer Margin Area', or the total margin space that is outside
#   of the standard plotting region (see graph)
#
# - The vector is ordered, the first value corresponding to the bottom. The entire
#   array is c(bottom, left, top, right)
#
# - All of the alternatives are:
#	- oma: Specify width of margins in number of lines
# 	- omi: Specify width of margins in inches
#	- omd: Specify width of margins in 'device coordinates'
#		- Device coordinates place (0,0) in the upper left and (1,1) in the
#		  lower right corner

par(oma=c(3,3,3,3))  # all sides have 3 lines of space
#par(omi=c(1,1,1,1)) # alternative, uncomment this and comment the previous line to try

# - The mar command represents the figure margins. The vector is in the same ordering of
#   the oma commands.
#
# - The default size is c(5,4,4,2) + 0.1, (equivalent to c(5.1,4.1,4.1,2.1)).
#
# - The axes tick marks will go in the first line of the left and bottom with the axis
#   label going in the second line.
#
# - The title will fit in the third line on the top of the graph.
#
# - All of the alternatives are:
#	- mar: Specify the margins of the figure in number of lines
#	- mai: Specify the margins of the figure in number of inches

par(mar=c(5,4,4,2) + 0.1)
#par(mai=c(2,1.5,1.5,.5)) # alternative, uncomment this and comment the previous line

# Plot
plot(x, y, type="n", xlab="X", ylab="Y")	# type="n" hides the points

# Place text in the plot and color everything plot-related red
text(5,5, "Plot", col="red", cex=2)
text(5,4, "text(5,5, \"Plot\", col=\"red\", cex=2)", col="red", cex=1)
box("plot", col="red")

# Place text in the margins and label the margins, all in green
mtext("Margins", side=3, line=2, cex=2, col="green")
mtext("par(mar=c(5,4,4,2) + 0.1)", side=3, line=1, cex=1, col="green")
mtext("Line 0", side=3, line=0, adj=1.0, cex=1, col="green")
mtext("Line 1", side=3, line=1, adj=1.0, cex=1, col="green")
mtext("Line 2", side=3, line=2, adj=1.0, cex=1, col="green")
mtext("Line 3", side=3, line=3, adj=1.0, cex=1, col="green")
mtext("Line 0", side=2, line=0, adj=1.0, cex=1, col="green")
mtext("Line 1", side=2, line=1, adj=1.0, cex=1, col="green")
mtext("Line 2", side=2, line=2, adj=1.0, cex=1, col="green")
mtext("Line 3", side=2, line=3, adj=1.0, cex=1, col="green")
box("figure", col="green")

# Label the outer margin area and color it blue
# Note the 'outer=TRUE' command moves us from the figure margins to the outer
# margins.
mtext("Outer Margin Area", side=1, line=1, cex=2, col="blue", outer=TRUE)
mtext("par(oma=c(3,3,3,3))", side=1, line=2, cex=1, col="blue", outer=TRUE)
mtext("Line 0", side=1, line=0, adj=0.0, cex=1, col="blue", outer=TRUE)
mtext("Line 1", side=1, line=1, adj=0.0, cex=1, col="blue", outer=TRUE)
mtext("Line 2", side=1, line=2, adj=0.0, cex=1, col="blue", outer=TRUE)
box("outer", col="blue")


# Further reading:
# http://cran.r-project.org/doc/manuals/R-intro.html#Multiple-figure-environment

Graphics
A project from the Center for Limnology - UW Madison
This site should be viewed with Firefox
 or Safari


