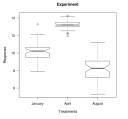
# Title: Boxplot Example
# Date: 2008-02-01
# Project: CFL R graphics

rm(list = ls())		# clear objects
graphics.off() 		# close graphics windows

# Generate datasets
y1=rnorm(50, mean=10, sd=1)
y2=rnorm(50, mean=13, sd=.5)
y3=rnorm(50, mean=8, sd=1.5)

# Vector of the names of the boxplots
x=c("January", "April", "August")

boxplot(y1, y2, y3,    # the three treatments being ploted
notch=T,               # if notches do not overlap ~ 95% confidence that medians are different
 names=(x),            # prints labels from the above vector "x" under boxplots
 pars=list             # controls the following graphical parameters
 (boxwex=.8,           # determines the width of the box
 staplewex=.6),        # determines the width of the whisker see "help(bxp)" for more information
 ylab="Response",      # y axis label
 xlab="Treatments",    # x axis label
 main="Experiment",    # graphic title
 las=1,                # controls the orientation of the axis labels (1=horizontal)
 cex.lab=1.1)          # controls the font size of the axis labels


#Code the following to see the default settings for the above plot: boxplot(y1, y2, y3)

Graphics
A project from the Center for Limnology - UW Madison
This site should be viewed with Firefox
 or Safari


