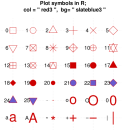
# Title: Demonstration of all of the possible PCH character selections
# Date: 2008-02-01
# Project: CFL R graphics

rm(list = ls())		# clear objects
graphics.off() 		# close graphics windows

# --------------------------------------------------------------------------
# Create function ('pchShow') which displays the graphics symbols in R
# Borrowed heavily from the example in help("points")

# FUNCTION ARGUMENTS
# ----------------------
# "extras": character symbols to plot (in addition to pch values 0:25)
# "symbolsize":  symbol size (magnification relative to default size);
#                 see help(par) / "cex" ; help(points) / "cex"
# "symbolcolor": symbol color (only color for symbols 0:21, and chars;
#                 edge color for pch 21-25.
#                 see help(par) / "col"; or help(points) / "col"
#                   also help(colors)
# "fillcolor":  the fill color for symbols 21-25; Also called "background" color
#                 ignored for all other symbols and characters
#                   see help(points) / "bg"
# "linewidth":  the width/weight of the lines used in plotting the symbols.
#               relative to the default value of 1.
#                see help(points) / "lwd" ; or help(par) / "lwd"
# "textcolor":  the color of the text which accompanies & identifies the symbols
# "textsize":   text size for the accompanying text on the plot.
#                 relative to default value of 1.  Use "0" for no labels.
# "main":       the title of the plot

pchShow <-
  function(extras = c(".", "o", "O", "0","a","A", "*", "+","-","|"),
           symbolsize = 3, #
           symbolcolor = "red3",
           fillcolor = "slateblue3",
           linewidth = 1,
           textcolor = "black",
           textsize = 1.2,
           main = paste("Plot symbols in R;\n  col = \"",
                        symbolcolor, "\",  bg= \"",fillcolor,"\"" )
           )
  {

# Organize symbols & characters to be plotted
# --------------------------------------------------------------------------

    nex <- length(extras)            # number of char graphics symbols to plot
    n_points  <- 26 + nex            # total number of symbols to plot
    ipch <- 0:(n_points-1)           # sequence of pch id numbers (0,1,2,...25)

    # create list of pch values (0:25); ('list' allows integers & strings)
    pchlist <- as.list(ipch)

    # Add the special characters to the list (if any)
    if(nex > 0) pchlist[26 + 1:nex] <- as.list(extras)

# Set up graphing space for display of symbols
# --------------------------------------------------------------------------
    # no. of columns to display in graph
    # (selected such that plot is close to square, nrows ~= ncols)
    k <- floor(sqrt(n_points))

    dd <- c(-1,1)/2             # padding of graph (+ 0.5 units on each side)

    # x coordinates for plotting symbols ('a %% b' means 'a modulus b';
    # that is, divides a by b and returns the remainder.)
    ix <- ipch %% k

    # y coordinates for plotting symbols ('a %/% b' indicates integer division,
    # that is, it returns the integer portion of the quotient only)
    iy <- 3 + (k-1)- ipch %/% k

    rx <- dd + range(ix)        # full range of x axis
    ry <- dd + range(iy)        # full range of y axis

    # create plot window
    plot(rx, ry, type="n", axes = FALSE, xlab = "", ylab = "", main = main)

    # display grid lines
    abline(v = ix, h = iy, col = "lightgray", lty = "dotted")

# Plot symbols and symbol labels (loops through each symbol type)
# --------------------------------------------------------------------------

    for(i in 1:n_points) {
      # for each value, i, get symbol id from list created ealier
      pch_i <- pchlist[[i]]

      # plot point at x(i), y(i), using the selected symbol.
      # Colors and size determined above
      # 'bg'-colored interior (only available for pch 21-25) :
      points(ix[i], iy[i], pch = pch_i, col = symbolcolor, bg = fillcolor,
          cex = symbolsize, lwd=linewidth)
      if(textsize > 0)
          text(ix[i] - .3, iy[i], pch_i, col = textcolor, cex = textsize)
    }
  }

pchShow()
#pchShow(c("a","A","b","B"), symbolsize = 2.5)
#pchShow({}, symbolsize = 4, linewidth=3)
#pchShow(c("a","A","b","B","c", "C", "1", "2", "3", "4"), symbolsize = 2.5)

Graphics
A project from the Center for Limnology - UW Madison
This site should be viewed with Firefox
 or Safari


